8 January 2020
Introduction
About me
- MSc in GIS at UCL
- PhD / Researcher at King’s College London
- The London Hybrid Exposure Model / Air quality GIS ‘stuff’


- Now at Guy Carpenter (Model development, Re-insurance)
Why measure air on the tube
Exposure to particles on subway systems > important
- Seaton et al 2005, but …
- Tox. mechanisms
- Susceptible populations
- Analytical techniques
Aims
What we tried to do
- Measure variations in PM2.5 between lines and stations
- Characterise the chemical composition
- Calculate calibration factors for optical instruments
- Provide a spatially resolved dataset for future analysis

Method
Mobile Measurement campaign
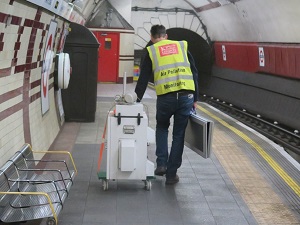
TSI AM510 SidePak (PM2.5) + Philips Aerasense (numbers and size of particles)31 hours, all lines89% of stations (NE Central, SW Piccadilly)- A long time down there with some fancy science equipment

Geo-tagging data
- Need to link air quality measurements to locations
- No GPS signal on large sections of the network
- Considered using timetables / interpolating between known locations
- Ended up using a notepad


Characterisation & Calibration
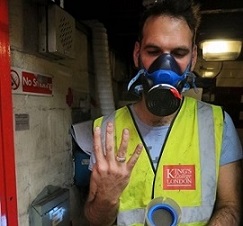
Particles collected on filters over 5 days measuring composition & amountHigh time resolution equipment installedAethalometer / TSI Dustrak / 2 TSI Sidepaks / Micro-aethalometer
- Some really fancy equipment on the platform at Hampstead
Passenger-weighted stations
- 2015 tap in/tap out, Underground performance report
- Annual in/out for each station
- Mean PM2.5 measured at each station
- Passenger rank * air quality rank = passenger-weighted ranking
Spatial representation of the tube

Results
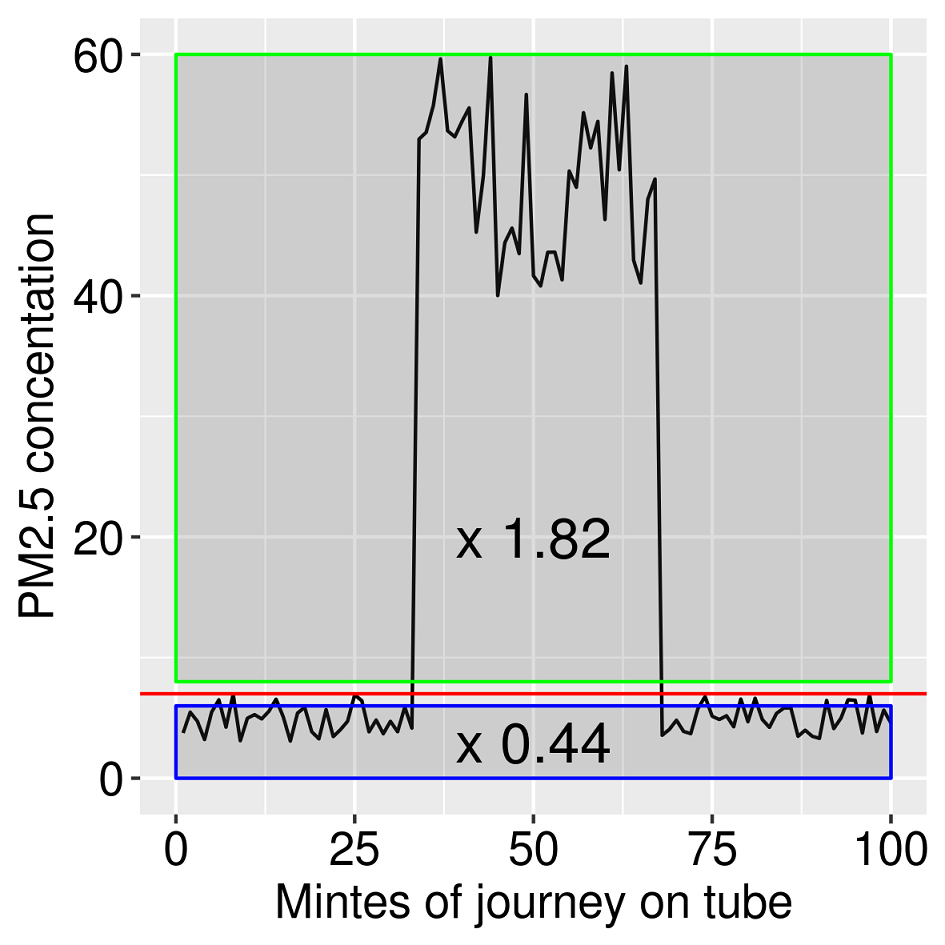
Calibration factors
- Linear model to calculate correction factors for mobile monitoring equipment
- Mobile monitoring equipment co-located in tube station v. outdoor
The Victoria Line


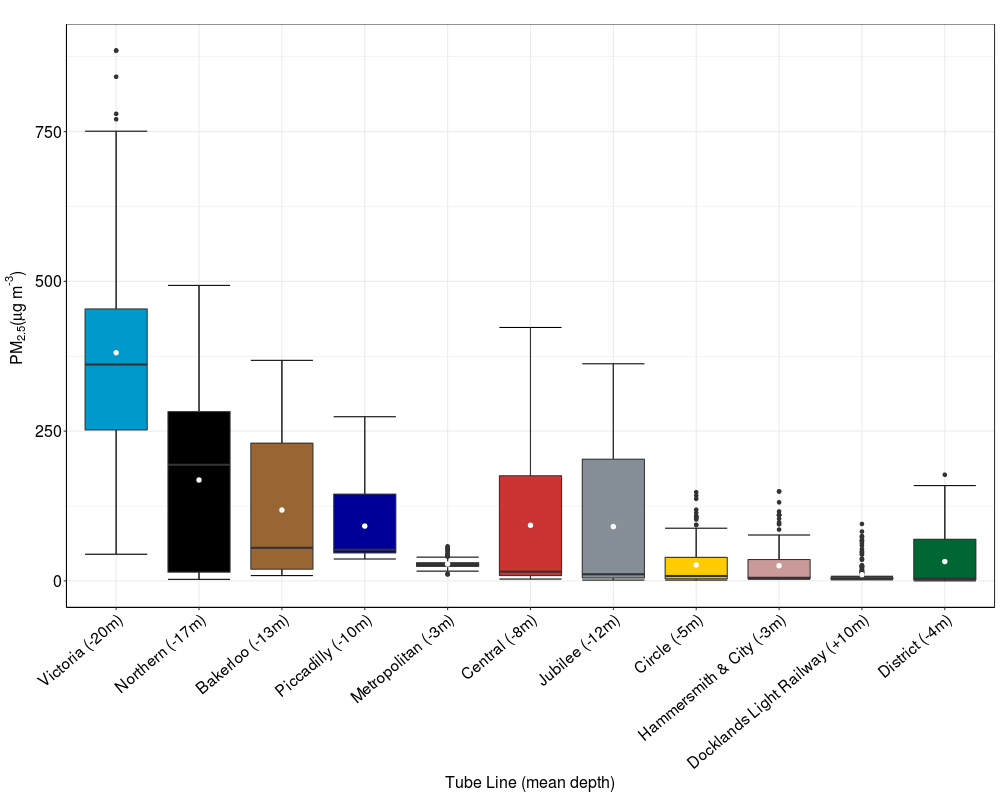
Line averages
Station depth 1
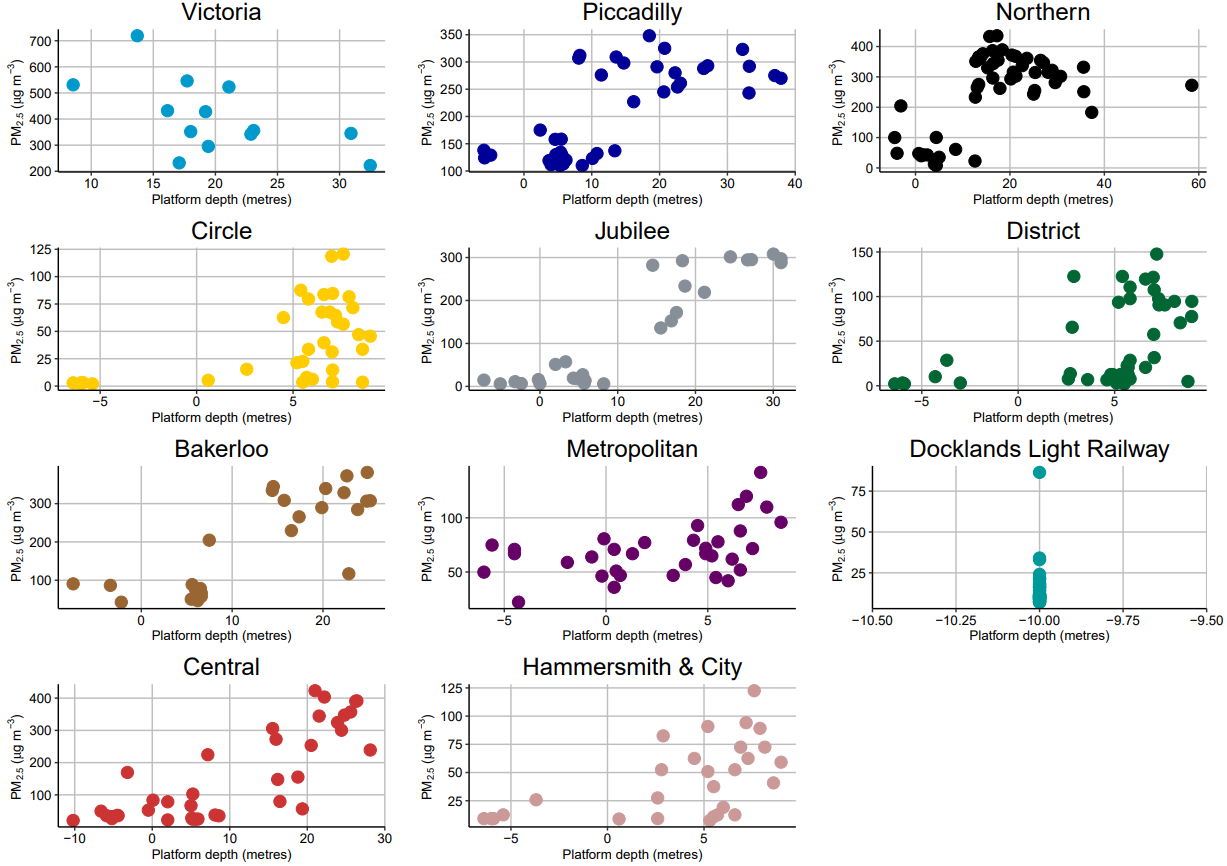
Station depth 2
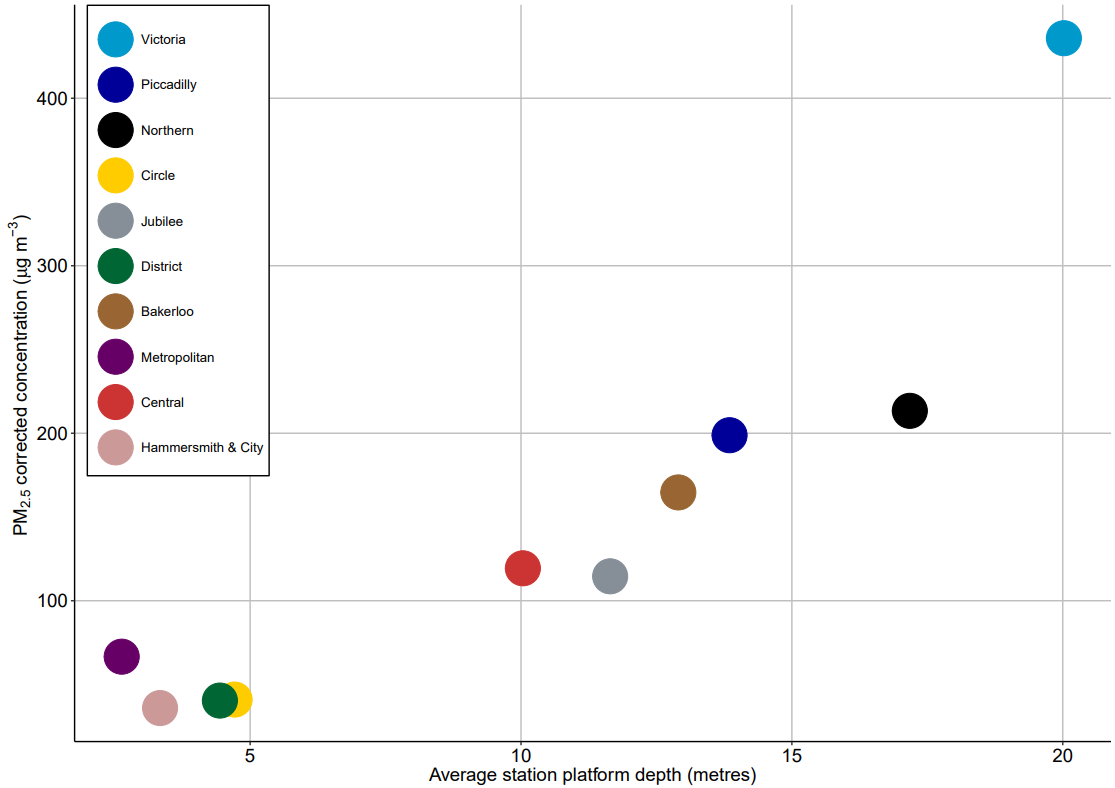
Depth on the Central Line

PM2.5 Map

PM2.5 online map

Passenger-weighted stations

Origin-Destination matrix

Characterisation

Conclusions
Conclusions
Particles tend to be larger in diameter than those at background or roadside environmentsMore particlesPM2.5 varied between lines & locationslowest Hammersmith & City (Mean 25 µg/m3), similar to roadsidehighest Victoria (381 µg/m3), 15 x higher than roadside
- There’s lots, they’re bigger than exhaust, and it really varies
Conclusions 2
- Relationship between ‘depth’ and air quality
- Oxford Circus, Waterloo, London Bridge, Victoria and Vauxhall = bleurgh
- We now know what most of it is
- Other studies need to re-evaluate
What next
What was planned
Characterise the remaining 11%More measurements accross the network to improve understandingtrain frequencypassenger numberstime of year
Interventions?Develop inclusion in exposure modelling
What happened